
From the early 1960s, the yield on the 10-year US Treasury note went from 4% to a peak of 15% by October 1981; it then declined steadily to a low of 0.5% in August 2020 at the height of the COVID-19 pandemic. It has since then reversed course, and by mid-September 2026, it is hovering just above 5%. The future trajectory of the 10-year Treasury yield is, of course, unpredictable; but the historical record suggests that the September 2026 yield levels have farther to go before testing the highs of the late seventies and early eighties.
The 10-year Treasury is uniquely important to the U.S. economy: It is the benchmark rate to which mortgage rates, auto loans and credit card rates are keyed. But it is of even greater significance for institutions holding assets backing long-dated liabilities; the market value of pension plan assets and their funded status are directly tied to Treasury yield levels. We assess the resilience of the top 10 largest public pensions by market value under sustained (one-year) long-bond market stress.
Economic scenarios and regime construction
Using the GALM™ Economic Scenario Generator (GESG), we simulate the 10-year Treasury note's holding period return over a 10-year horizon and define three broad economic regimes: stressed, base, and rally. These regimes are respectively characterized by the lower, middle, and upper 20% of holding period returns, with the second and fourth quintiles left as transition bands to offset the base regime from the stressed and rally regimes.
Markets are interdependent, and this interdependence tends to increase during a crisis. We capture this dynamic dependence structure by producing joint scenarios covering interest rates, credit spreads, public equity, property and the benchmark proxies used for private equity and other investments. Portfolio returns reflect these markets' combined movements, capturing the overall portfolio response to long-bond market stress. The GESG thus ensures that the scenarios are at once economically coherent and statistically probable.
Plan portfolios at a glance
The ten largest US public pension plans by reported FY2025 asset market value in the Public Plans Data (PPD) are shown below. Together, they hold $2.22 trillion in assets, representing 40.7% of assets reported across 187 plans in the PPD extract accessed in September 2026.
| Plan | Assets ($bn) |
|---|---|
| California Public Employees' Retirement System (CalPERS) | 562.98 |
| California State Teachers' Retirement System (CalSTRS) | 370.18 |
| New York State and Local Employees' Retirement System (NYSLRS ERS) | 230.45 |
| Teacher Retirement System of Texas (Texas TRS) | 226.33 |
| Florida Retirement System (FRS) | 212.59 |
| New York State Teachers' Retirement System (NYSTRS) | 154.19 |
| Teachers Retirement System of Georgia (Georgia TRS) | 116.77 |
| Ohio Public Employees Retirement System (OPERS) | 116.66 |
| Virginia Retirement System (VRS) | 114.40 |
| University of California Retirement Plan (UCRP) | 110.81 |
The figure below shows target allocations by asset category. Target allocations use fiscal-year 2025 observations from the PPD database [1]. Benchmark mappings are supplemented by individual plan reports [2-12]. Public equity has the largest target weight in every plan except Texas TRS, which has real assets as its dominant category with a 36.8% allocation. Public equity allocations range from 10.5% for Texas TRS to 65.0% for Georgia TRS. Fixed income allocation ranges between 14.0% and 30.0%. Fixed-income duration, represented by modeled weighted tenor, ranges from 3.14 years for UCRP to 13.82 years for Texas TRS, as reported in Exhibit 6.
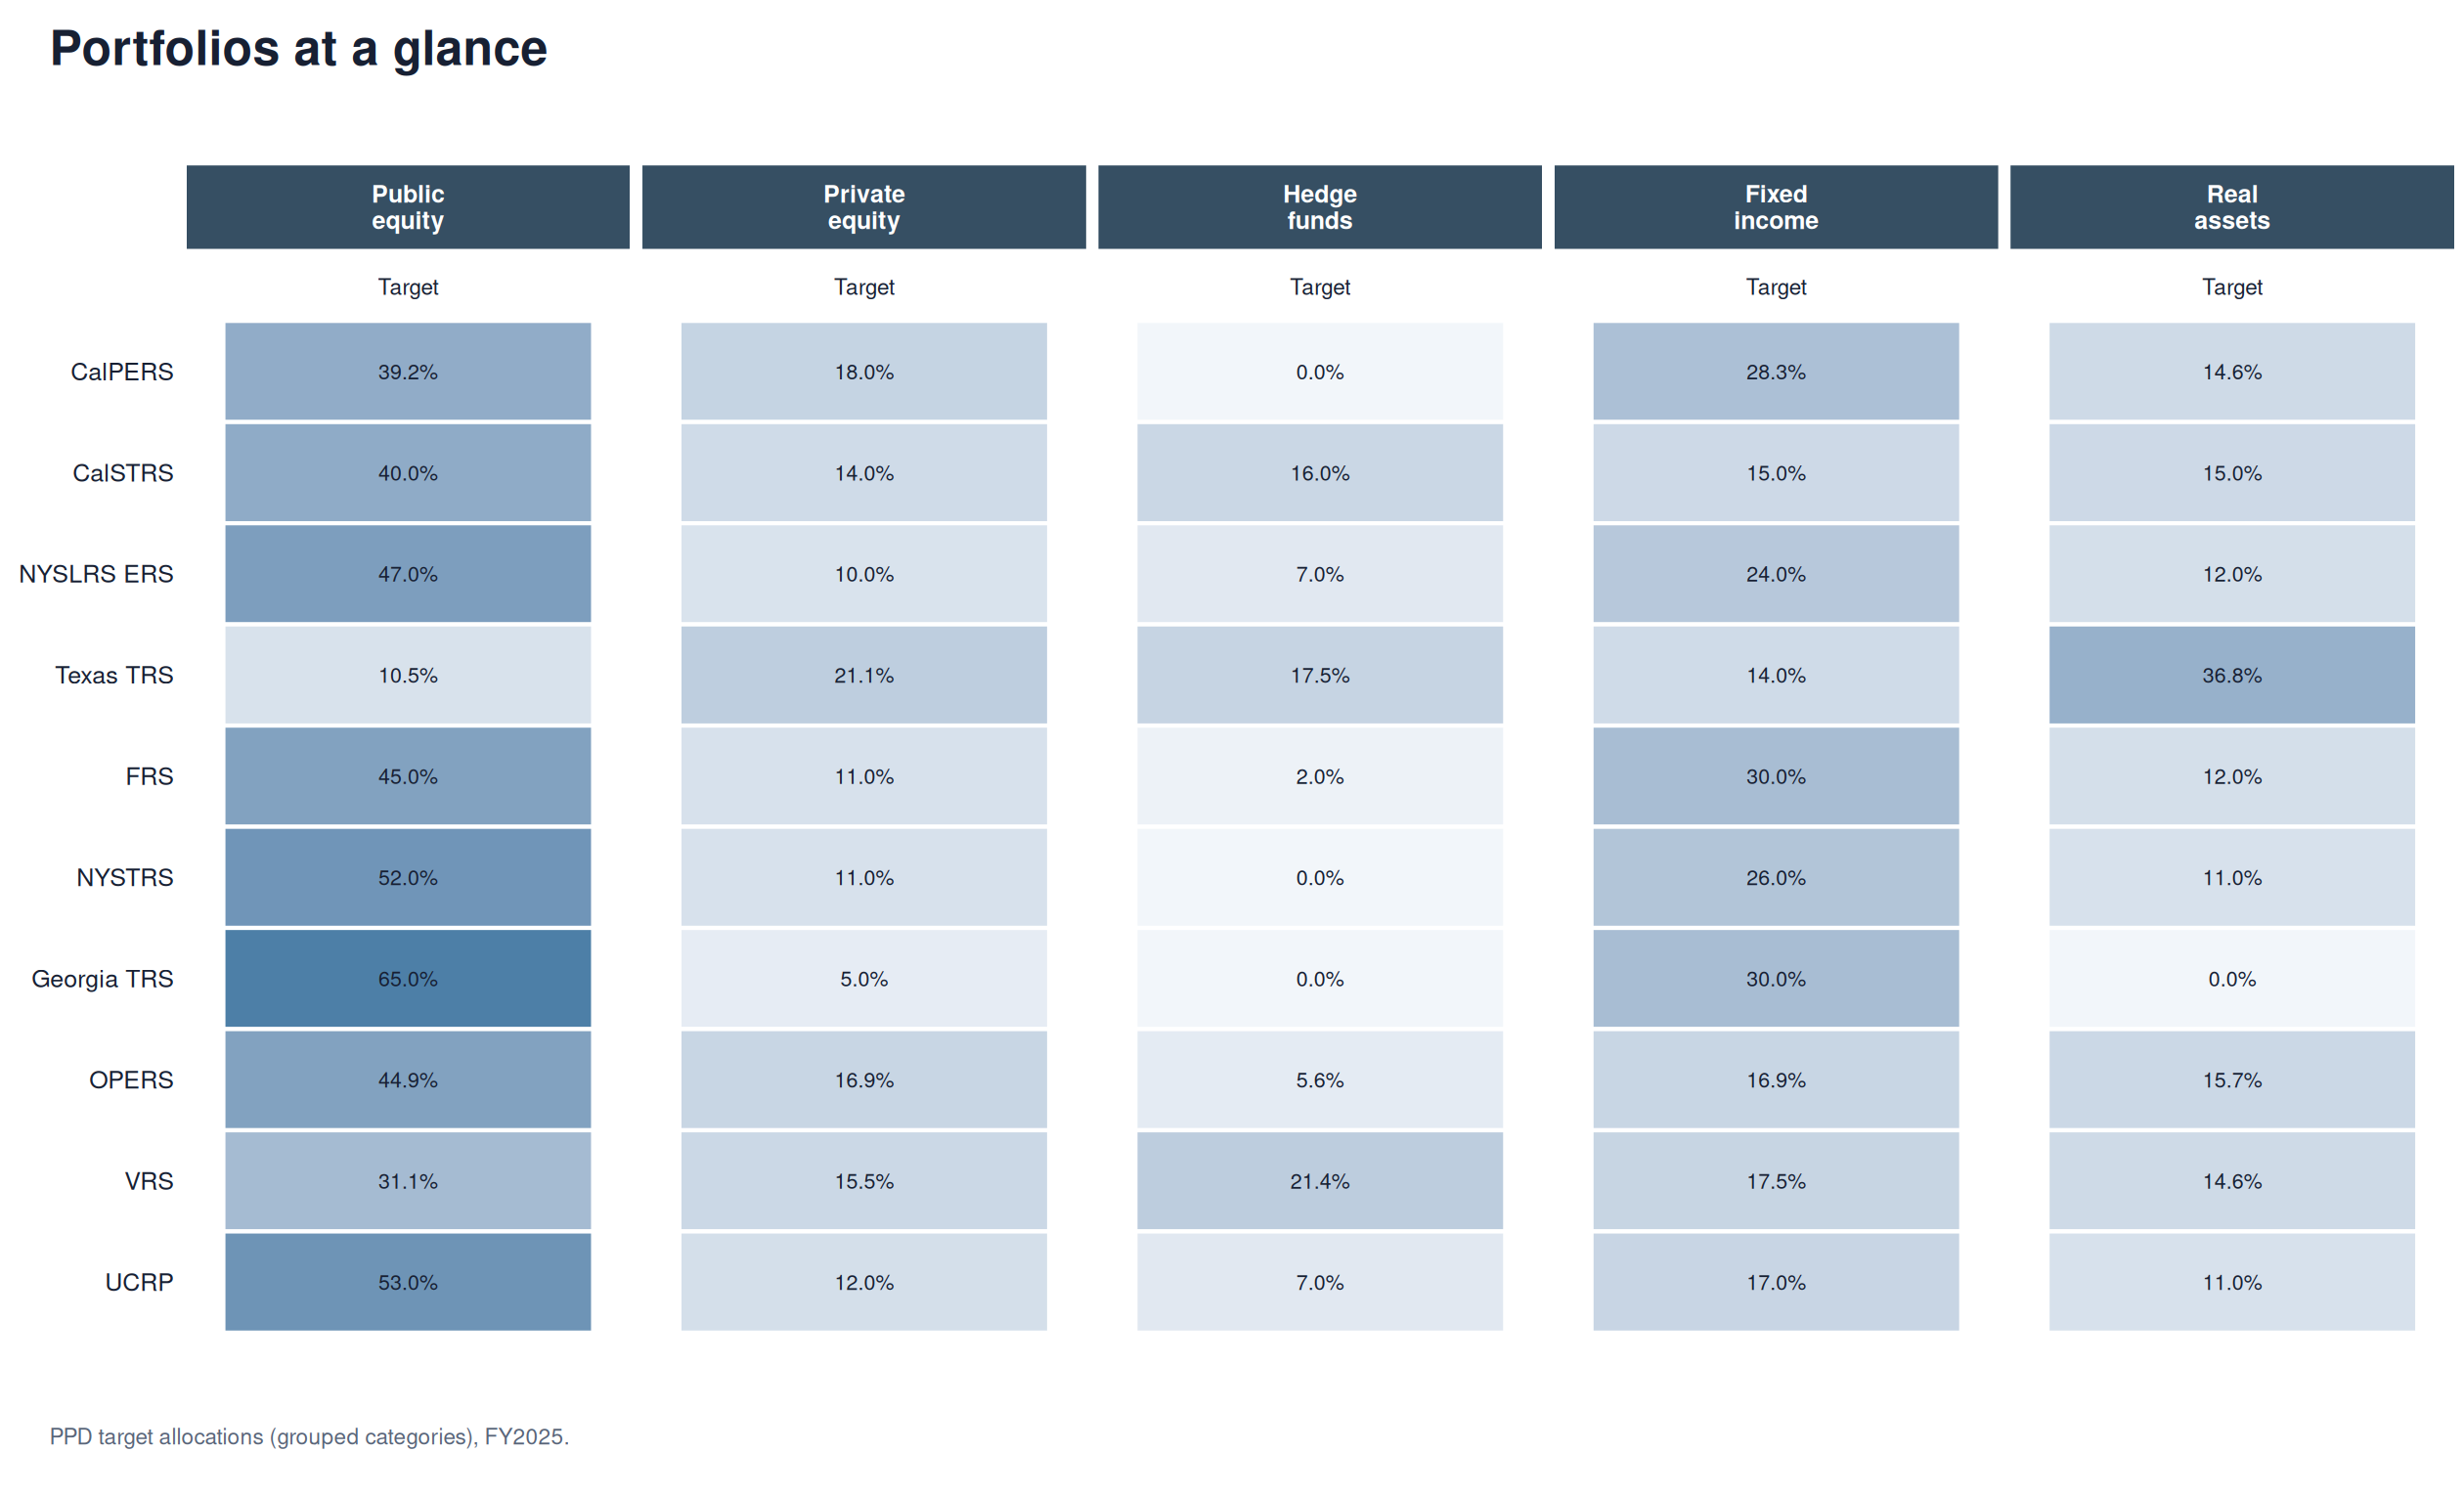
Exhibit 2: Portfolios at a glance
The simulated shocks
Treasury yields are sourced from FRED’s constant-maturity series, which report par yields on an investment basis. We bootstrap the par yield curve to obtain spot rates and express them as continuously compounded annual rates. We define the one-year holding-period returns as: $$ Holding\ Period\ Return_t = \exp(10 * Spot_{t-1}^{10} - 9 * Spot_{t}^{9}) - 1 $$ where $Spot_t^{m}$ is the $m$-year spot rate in year $t$. The distribution of 10-year Treasury holding period returns is reproduced in Exhibit 3.
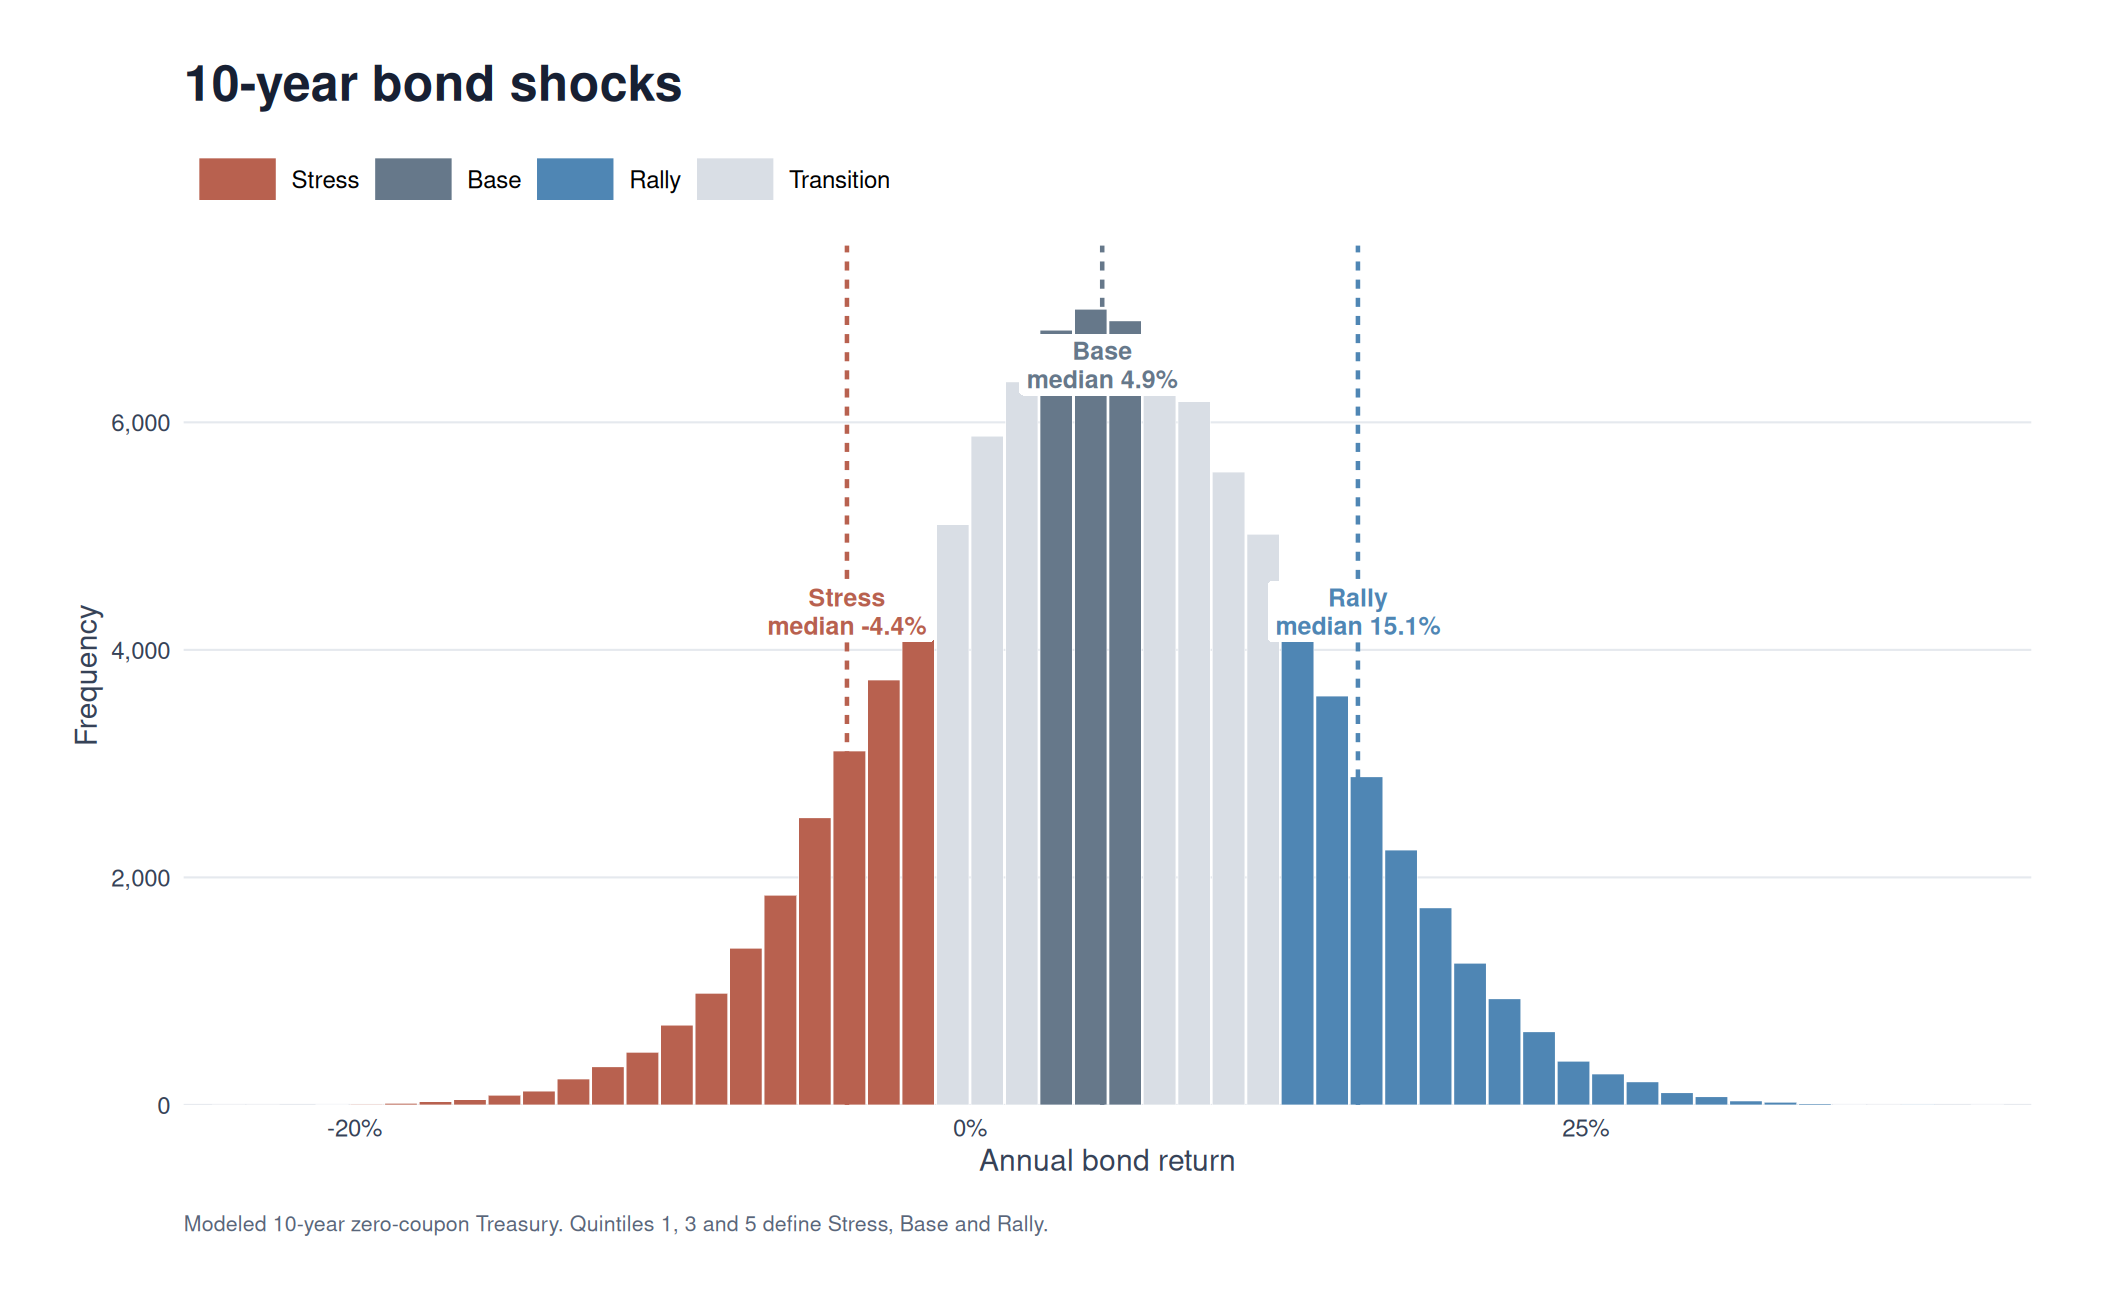
Exhibit 3: 10-year Treasury shocks
Table 2 reports the simulated ranges. These regimes' ranges and medians align with historical episodes. The 2022 inflation and monetary-tightening shock produced an estimated one-year Treasury holding-period return of -17.58%, falling within the stressed regime’s range. On the other end of the spectrum, the flight to safety during the 2008 financial crisis generated 23.90%, while pandemic-era easing in 2020 generated 12.31%, both within the rally regime’s range. The bulk of simulated holding-period returns lies between -6.80% and 18.15%, the 5th and 95th percentiles, respectively.
| Environment | Quintile | Return range | Median return |
|---|---|---|---|
| Stress | 1 | -23.66% to -1.26% | -4.36% |
| Base | 3 | 3.02% to 6.82% | 4.91% |
| Rally | 5 | 11.50% to 44.73% | 15.10% |
Portfolio returns by regime
Portfolio returns are simple returns: $$AssetValue_t/AssetValue_{t-1}-1.$$Exhibit 4 reports portfolio returns across regimes. Average annual returns in the stressed regime range from 4.27% for Texas TRS to 8.92% for NYSTRS. Across the ten portfolios, average annual returns in the stressed regime are 1.19 percentage points lower than in the rally regime. Relative to the base regime, average annual returns in the stressed regime are 49 basis points lower. Every portfolio has a negative 5th-percentile return in the stressed regime despite a positive average.
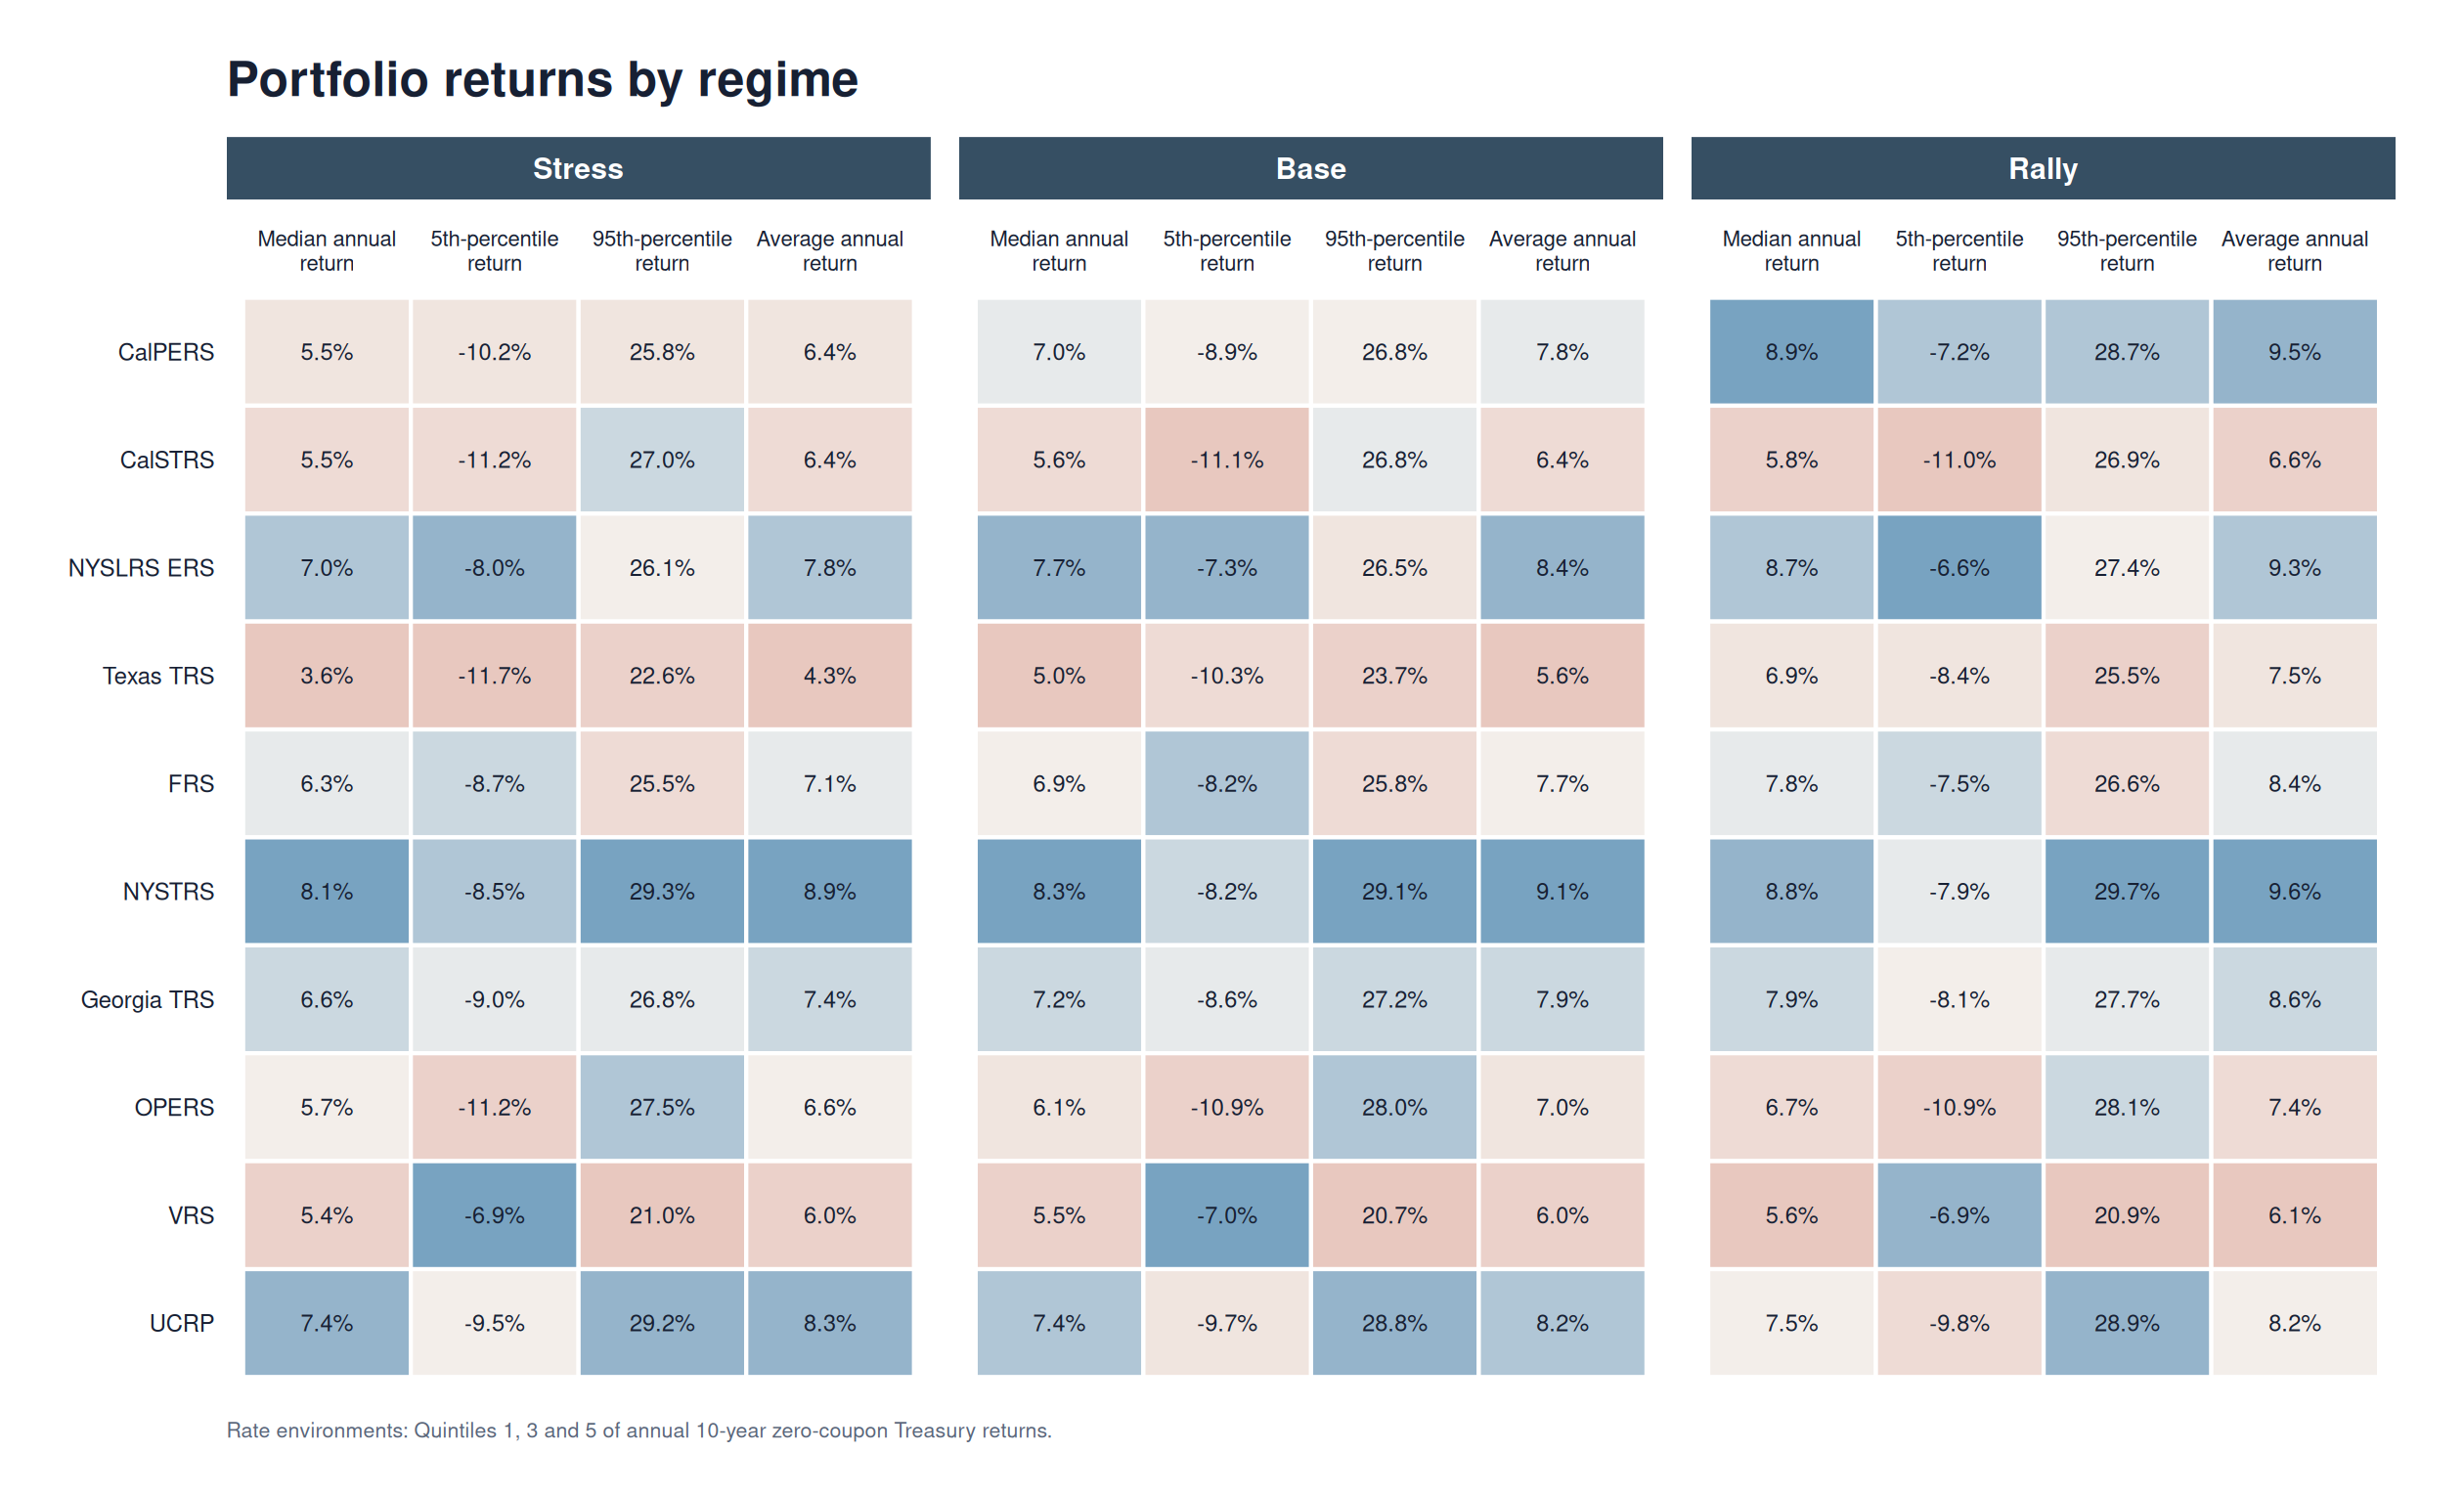
Exhibit 4: Portfolio returns by regime
We define resilience to long-bond market stress as the gap between the average portfolio return in the stressed regime and the average return in the base regime, i.e., $$ Resilience = Average\ Stress\ Return - Average\ Base\ Return$$ Higher values indicate greater resilience under this definition. Exhibit 5 ranks the plans by resilience to long-bond market stress. CalPERS and Texas TRS have the most negative values, -1.41 and -1.35 percentage points; CalSTRS is nearly unchanged at -2 basis points. UCRP and VRS have positive values of 15 and 3 basis points. UCRP and VRS allocate 17.0% and 17.5% to modeled bonds, respectively, leaving most of their portfolios exposed to equity and other assets. Their positive resilience indicates that, on average, returns from those other assets more than offset bond losses relative to the base regime. On the other hand, the resilience ranking for Texas TRS is less readily explained by the relatively small 14.0% fixed-income allocation, the smallest out of the 10 plans. In addition, NYSTRS ranks high despite a relatively large fixed-income allocation of 26%.
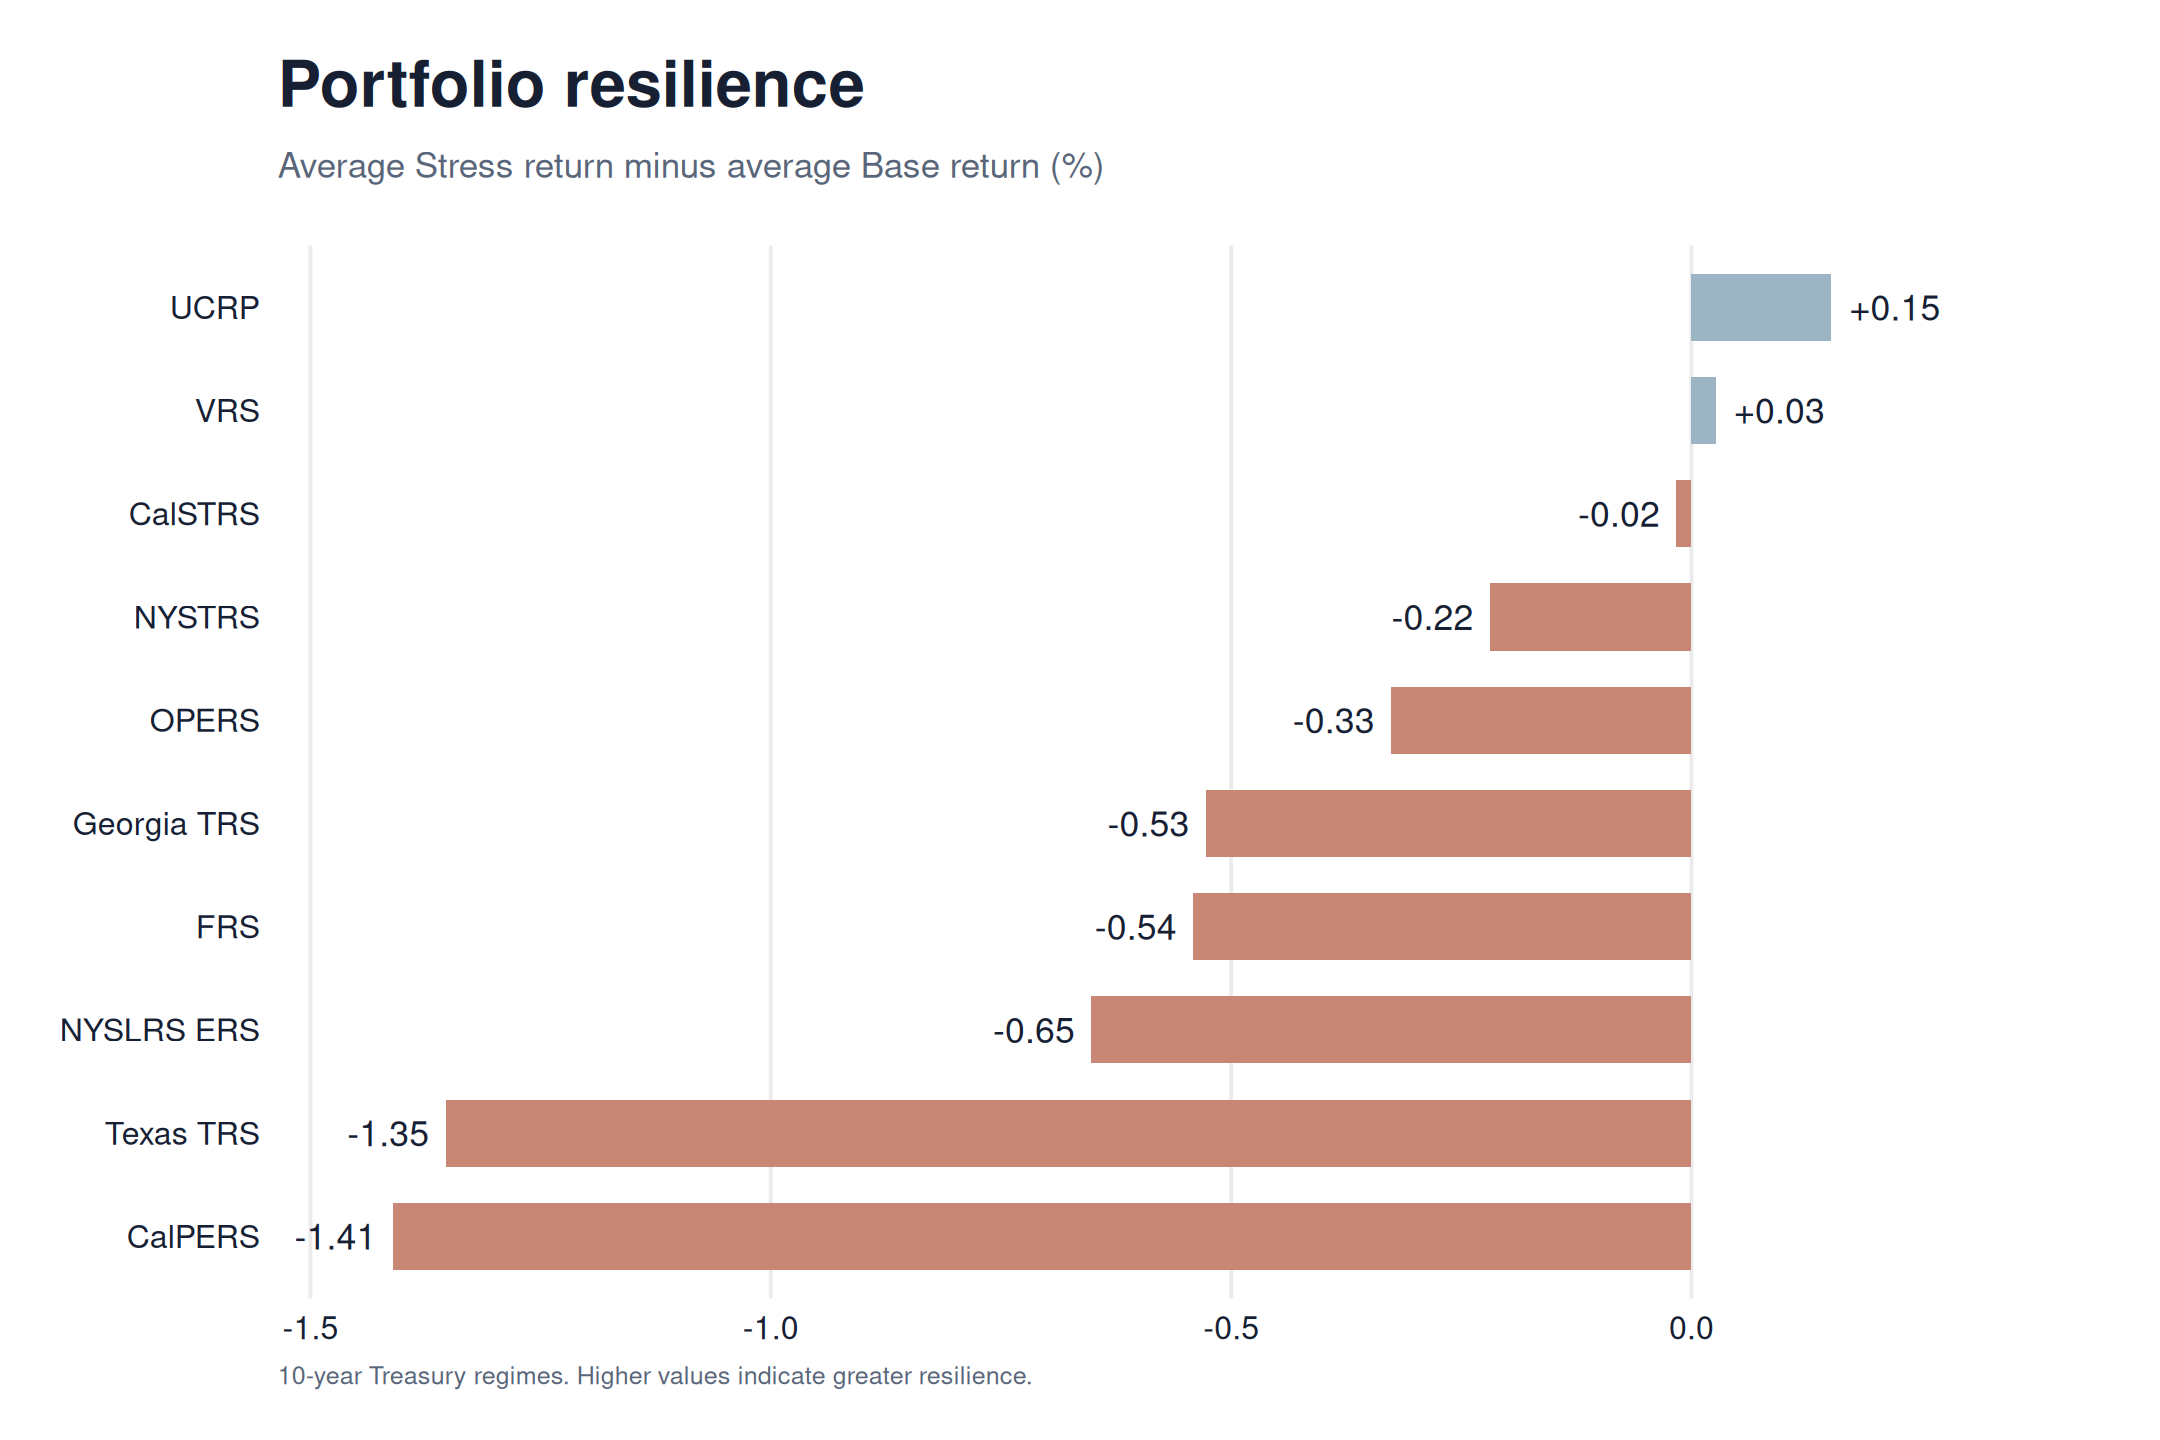
Exhibit 5: Resilience ranking
Exhibit 6 ranks portfolios by the same resilience measure alongside fixed-income target allocation, market-value-weighted tenor, and portfolio duration. Weighted modeled tenors are informed by PPD component-duration data and ETF proxies where information is unavailable. Portfolio duration is defined as: $$Portfolio\ Duration = Fixed\ Income\ Allocation * Fixed\ Income\ Duration$$ Texas has 14.0% in modeled bonds, but a weighted tenor of 13.82 years, compared with Georgia's 30.0% and 5.00 years. Across the ten portfolios, the correlation between modeled portfolio duration and the resilience measure is approximately -0.95. Allocation and tenor together therefore give a different exposure ordering than allocation alone. In this instance, where the source of the stress is the long end of the curve, the closer the portfolio duration is to zero, the more resilient it is to stresses originating from the long end of the curve.
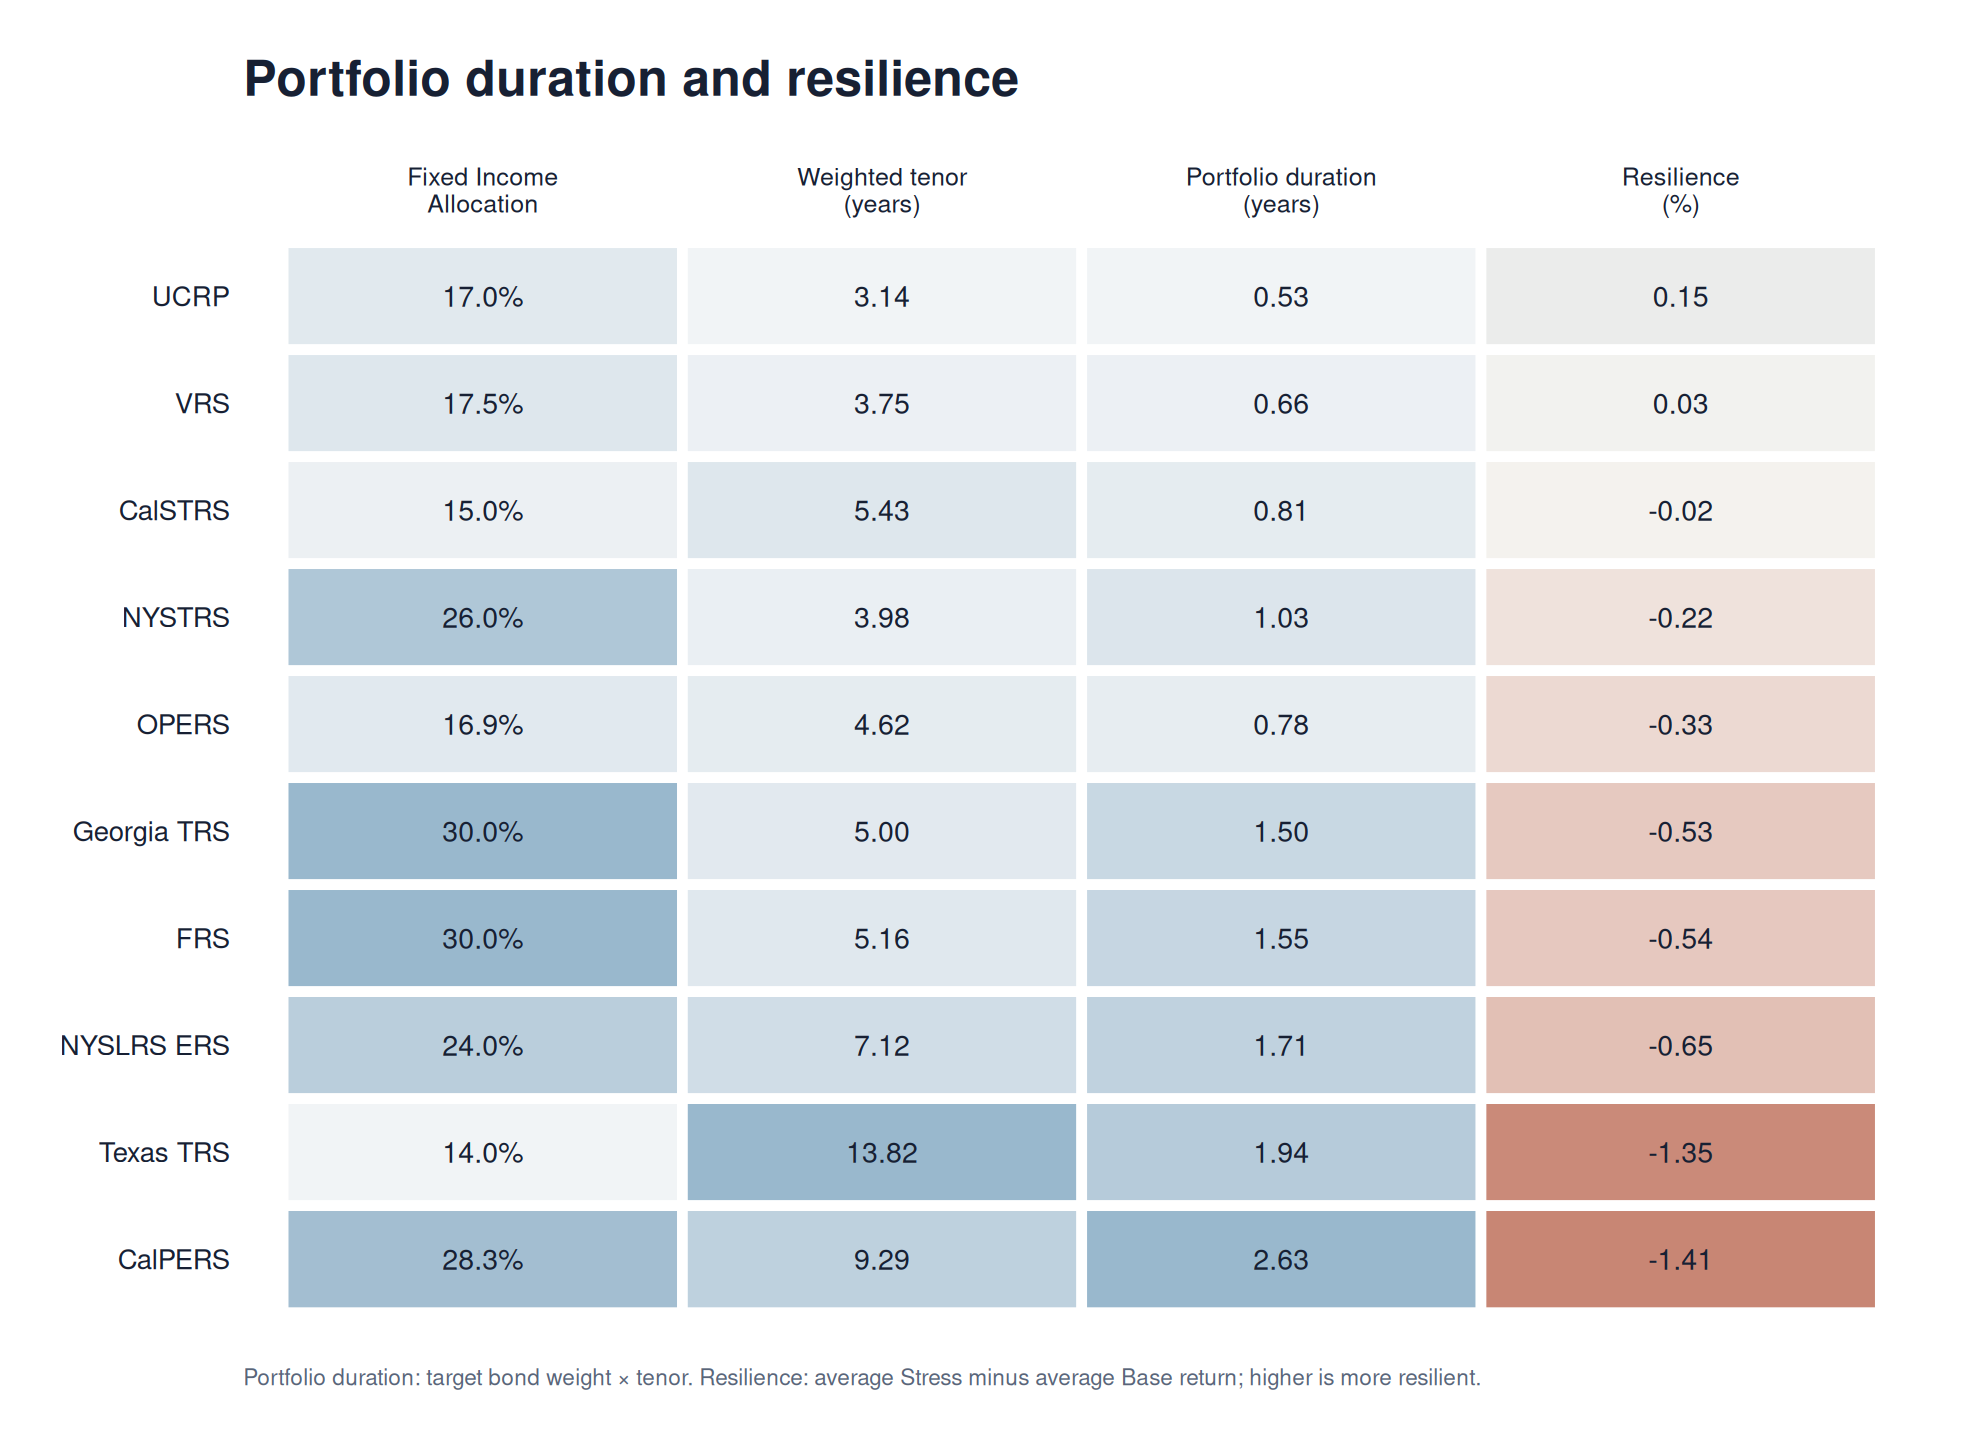
Exhibit 6: Portfolio duration and resilience
Conclusion
Average stressed-regime returns remain positive for all ten portfolios. Relative to Base, average deterioration is modest overall: 49 basis points across the ten portfolios. The strong resilience to long-bond stress can be accounted for, partly, by a relatively low fixed-income allocation across the 10 plans: 30% or less. Non-fixed-income asset performance is the main contributor to portfolio performance.
Moreover, bond allocation is only part of the story. As demonstrated in the case of NYSTRS, a portfolio with a relatively large fixed-income allocation can demonstrate strong resilience to long-bond stress if the component bond durations are short enough. The reverse also holds: Texas TRS with a small bond allocation can still contribute substantially to portfolio duration when its tenor is long. The allocation and the portfolio's effective duration must therefore both be accounted for.
About Soborro
Expert portfolio risk analysis. Economic scenarios, portfolio stress testing and model review.
Notes
Data and portfolio construction. Asset values and target allocations use FY2025 Public Plans Data observations [1]. Bond component-duration inputs use FY2022 observations where available, supplemented by published reports and ETF proxies [4, 9, 13]. For OPERS, missing component durations and sector detail are estimated using policy weights and representative ETF durations. The modeled portfolios represent published allocation categories through market benchmarks.
Duration and allocation. Exhibit 6 uses target-weighted modeled bond tenors. Portfolio duration is the bond allocation multiplied by its weighted tenor, treating nonbond assets as having zero duration for this calculation.
Scenarios and returns. The analysis uses 10,000 ten-year paths, providing 100,000 annual observations per portfolio. Regimes are classified by one-year Treasury returns. Portfolio averages are arithmetic annual returns. Results concern asset performance, not modeled liabilities or funded-status changes.
References
- Public Plans Data. Public Plans Database. 2001-2025. Center for Retirement Research at Boston College, MissionSquare Research Institute, National Association of State Retirement Administrators and Government Finance Officers Association. https://publicplansdata.org/public-plans-database/ (accessed September 3, 2026).
- CalPERS. CalPERS Trust-Level Review as of December 31, 2025.
- CalSTRS. Semi-Annual Private Equity Performance Review, Period Ending September 30, 2023. March 2024.
- CalSTRS. Semi-Annual Performance Report, Period Ending June 30, 2024. September 2024.
- CalSTRS. Risk Mitigating Strategies Semi-Annual Activity Report, December 31, 2025.
- New York State and Local Retirement System. 2025 Annual Comprehensive Financial Report.
- State Board of Administration of Florida. FRS Pension Plan Investment Policy Statement. March 5, 2025.
- New York State Teachers' Retirement System. Investment Policy Manual. October 2025.
- Ohio Public Employees Retirement System. 2025 Annual Comprehensive Financial Report.
- Teacher Retirement System of Texas. 2025 Annual Comprehensive Financial Report; Board Book - IMD - April 2026.
- University of California Retirement Plan. Investment Performance Report as of March 31, 2025. May 2025.
- Virginia Retirement System. Fiscal Year 2025 Investment Highlights; Investment Report for the Quarter Ending December 31, 2025; Investments Report for the Quarter Ending March 31, 2026.
- iShares and Invesco. Fixed-Income ETF Factsheets. 2026. US Securities and Exchange Commission. Form N-PORT Filings. Reporting dates: February 28 and April 30, 2026.
- Teachers Retirement System of Georgia. 2024 Annual Comprehensive Financial Report.